Developer Dashboard is a new feature in SharePoint 2010 , to take a look and understand the page performance . Now developer can see various performance related information and can optimize page performance accordingly .This feature was not availaible in early version of SharePoint .
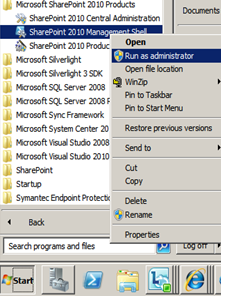
1.Open Sharepoint 2010 Management Shell as administrator .

2.Basically their are 3 modes which Sharepoint 2010 provides for Developer Dashboard
a.) on - dispalys Developer Dashboard at the bottom of all the pages everytime
b.) off - it will disable the Developer Dashboard
c. ) onDemand - displays the Developer Dashboard on click of an icon , at top-right corner of the page.Developer Dashboard will be at the bottom of the page .
Note : Below is the example showing onDemand mode powershell script
$contentService =[Microsoft.SharePoint.Administration.SPWebService]::ContentService
$dashboardSetting = $contentService.DeveloperDashboardSettings
$dashboardSetting.DisplayLevel =[Microsoft.SharePoint.Administration.SPDeveloperDashboardLevel]::OnDemand
$dashboardSetting.Update()
$dashboardSetting = $contentService.DeveloperDashboardSettings
$dashboardSetting.DisplayLevel =[Microsoft.SharePoint.Administration.SPDeveloperDashboardLevel]::OnDemand
$dashboardSetting.Update()
3. Execute the above script on Sharepoint 2010 Poweshell .
4. An icon at the top-right corner of the page will gets appear .
5. Click the icon , now you can see your Developer Dashboard at the bottom of the page .


No comments:
Post a Comment